

Nya instrumentpaneler innebar antingen tekniska inställningar eller att man fick vänta på IT-avdelningen
Frågor, rapporter och widgets visas som separata skärmbilder
En snabb fråga innebar att jag fick skapa ett diagram för hand
Rollspecifika vyer innebar att man var tvungen att gå igenom irrelevant data
Describe a metric in plain English and the AI builds the widget
See a preview of the live data before anything is added
Widgets follow your date, warehouse and account filters
Rename it by asking, or drag and resize it yourself
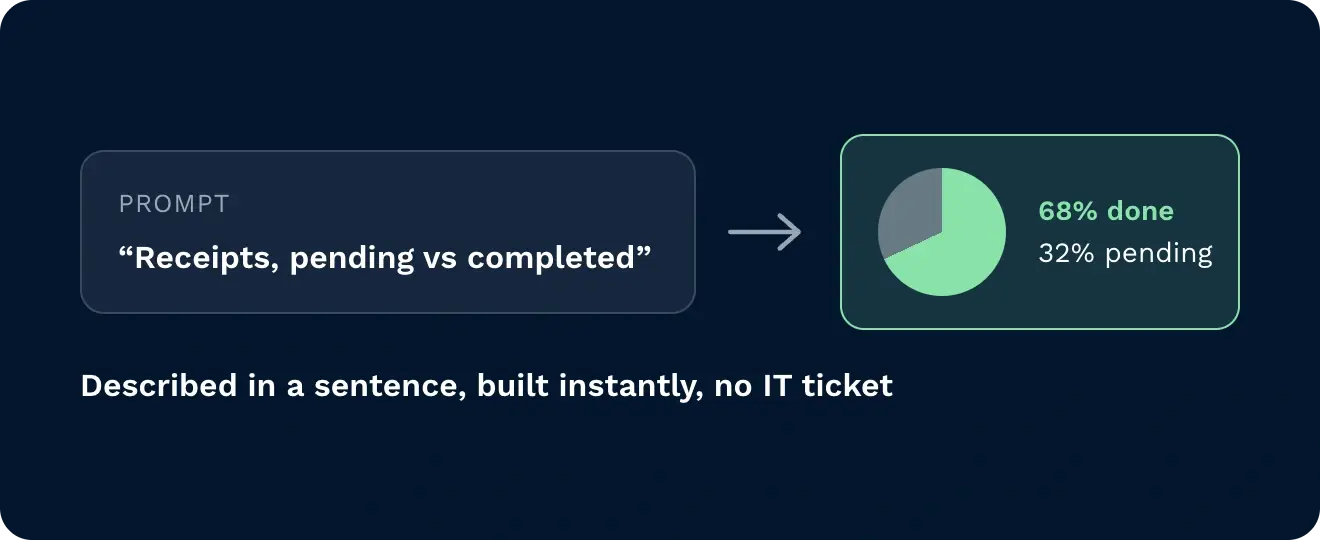
Beskriv det mått du behöver och AI:n skapar det direkt, utan manuell konfiguration eller väntetid på IT-avdelningen. En enkel kommando gör att kvitton omvandlas till ett cirkeldiagram som visar vad som är pågående respektive avslutat, eller att beställningar omvandlas till ett stapeldiagram sorterat efter vem som har mest att göra.
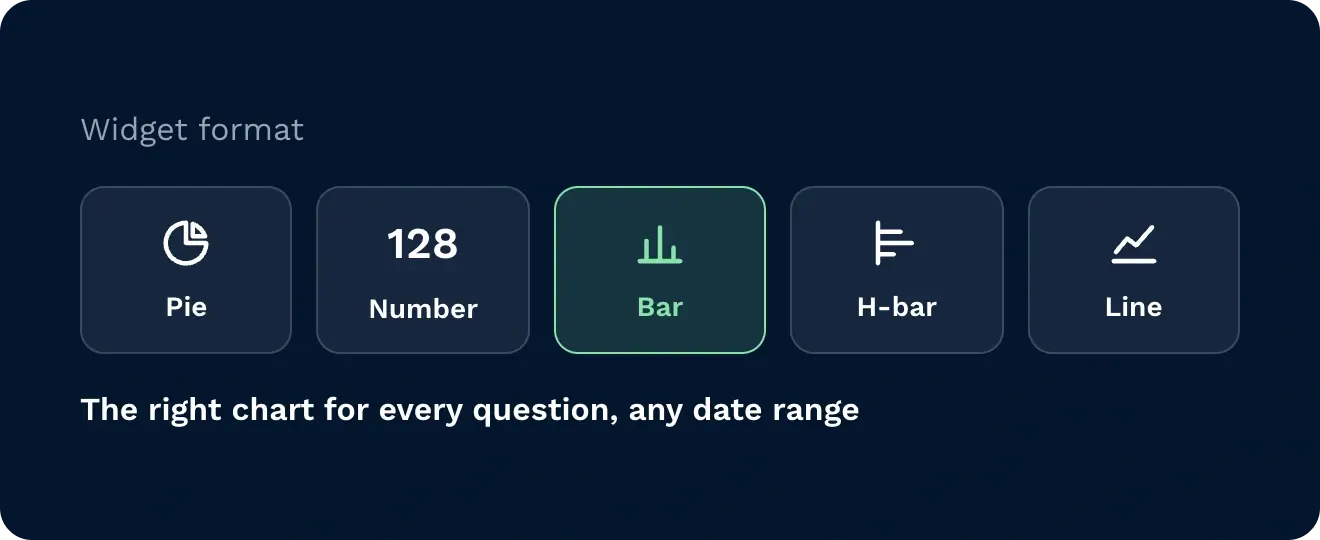
Not every metric needs the same chart. Ask for a pie, a single number, a bar or horizontal bar, or a line chart, from receipts by status to goods in received per day across the date range you pick.
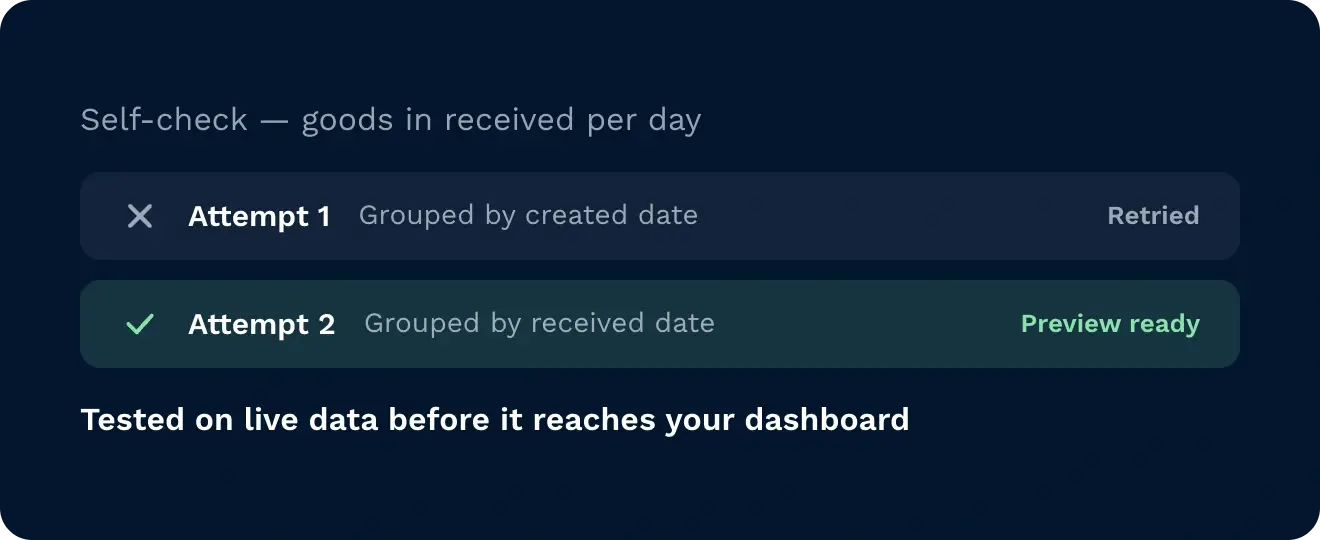
The AI tests its query and shows you a preview of the live data before a widget lands. If an attempt fails, it tries another way, for example grouping by a different date field, until the result matches what you asked for.
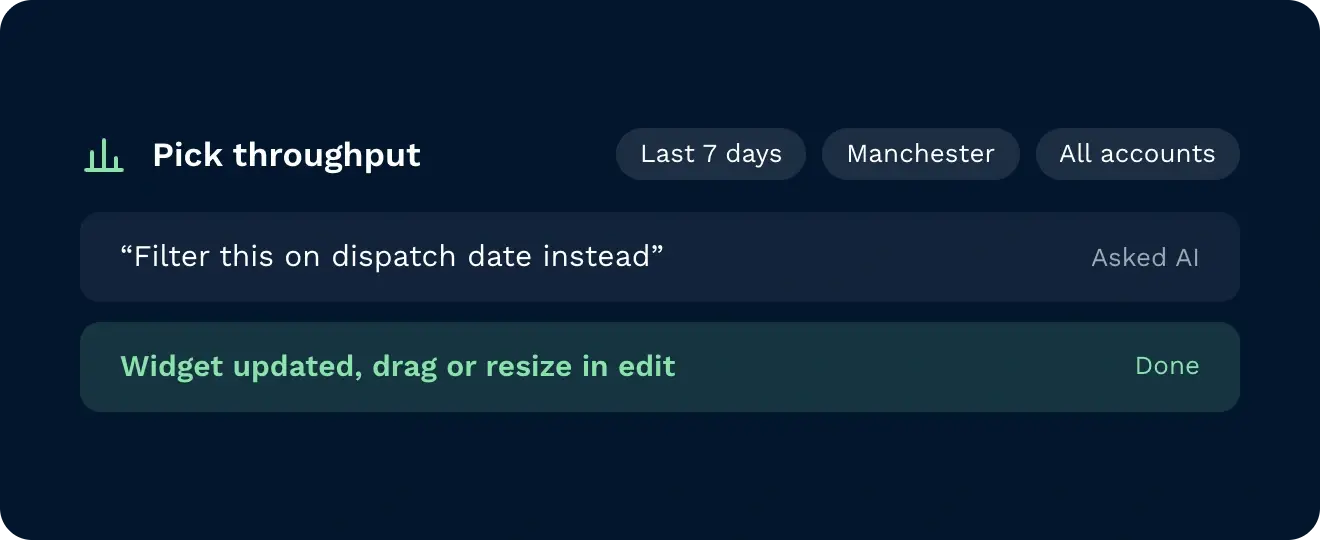
Every widget follows the dashboard filters for date, warehouse and account. Ask the AI to rename a widget or change which date it filters on, or press edit to drag and resize it.
När du behöver siffror har du inte råd att vänta på en rapportförfrågan. Skräddarsydda instrumentpaneler, skapade med hjälp av AI, svaret visas på några sekunder, så att en statusöversikt blir ett cirkeldiagram, antalet slutförda beställningar blir ett nyckeltal och plockprestandan blir ett stapeldiagram sorterat efter vem som har mest att göra. Om du väljer ”Trend” visas inkommande varor som ett linjediagram över det tidsintervall du väljer. Filtrera efter lager och datum, och döp sedan om, ändra storlek på eller flytta vilken widget som helst på några sekunder. Skräddarsydda översiktspaneler eliminerar väntetiden så att du kan fokusera på lager, order och personal där det är viktigast.

Se status för kvitton, order och plockning utan att behöva vänta på att någon ska sammanställa uppgifterna. Be om en specifikation, en sammanställning eller en trend, så uppdateras instrumentpanelen på några sekunder, kan sorteras efter lager och datum.

Håll koll på vem som har mest att göra vid upphämtningen och upptäck om det uppstår ett avbrott innan skiftet hamnar efter i schemat. Begär uppgifter per användare och få ett stapeldiagram sorterat efter volym, som uppdateras i realtid. Filtrera efter lager utan att byta skärm.

Håll koll på slutförda beställningar och mottagningsstatus utan att behöva skapa en rapport från grunden. Be om en sammanställning över slutförda beställningar eller en översikt över mottagna varor per dag. Ingen manuell sökning, ingen väntan på IT-avdelningen.
Du beskriver vad du vill se, och det skapas automatiskt. Det finns ingen frågebyggare, ingen diagramkonfiguration och du behöver inte välja datakälla manuellt. Du skriver in en förfrågan i vanligt språk, och en fungerande widget dyker upp på din instrumentpanel.
Om du kan beskriva måttet kan du skapa widgeten. Inget SQL, inga filter som måste konfigureras manuellt. Begär kvitton efter status, antalet slutförda beställningar eller plockuppgifter per användare, så tar AI:n hand om hur det ska visas.
Den väljer rätt format för frågan, inte bara diagram. En statusfördelning blir ett cirkeldiagram, en rangordnad jämförelse blir ett stapeldiagram, en trend över tid blir ett linjediagram och en enkel summa blir ett enda tal.
Den kontrollerar sitt eget arbete innan widgeten publiceras. Om det första försöket att gruppera data inte stämmer överens med vad du begärt, korrigerar AI:n själv sökfrågan så att det som visas på instrumentpanelen blir korrekt.
Ingenting är fastställt när det väl finns på instrumentpanelen. Widgets kan döpas om, ändras i storlek eller flyttas, och instrumentpanelen kan fortfarande filtreras efter datumintervall och lager efter att den har skapats.
Yes. Build as many as you need, for example an operations overview for one person and a picking view for another.
Yes. Widgets follow the dashboard’s date, warehouse and account filters, and you can ask the AI to filter on a different date field.
Fortfarande osäker? Se hur Clarus hanterar det på fyra minuter varumottagning, plockning och leverans. Du kommer att se varför Våra kunder säger hela tiden ”ja” till nya avtal.