

Inventory turnover is the number of times a business sells and replaces its stock over a set period, usually one year. You calculate it by dividing cost of goods sold by average inventory, and a higher figure means stock is moving faster. For a warehouse or 3PL, the number is only as reliable as the stock records behind it, so the floor matters as much as the finance calculation.
What is inventory turnover?
Inventory turnover is the number of times stock is sold and replaced in a given period. A turnover of 6 means the stock cycled six times over the year. The same measure is often called stock turnover or stock turn, and warehouse teams use all three terms interchangeably. For a quick definition, the Wikipedia entry on inventory turnover och tutor2u’s business reference both set out the basic ratio. Accountancy bodies such as the ICAEW cover how inventories are measured, which feeds into ratios of this kind.
Whatever you call it, the ratio shows how much of your working capital is tied up in goods and how long those goods stay in your building. If you already track a set of warehouse KPIs, inventory turnover belongs alongside order accuracy and the time stock takes to become available for picking.
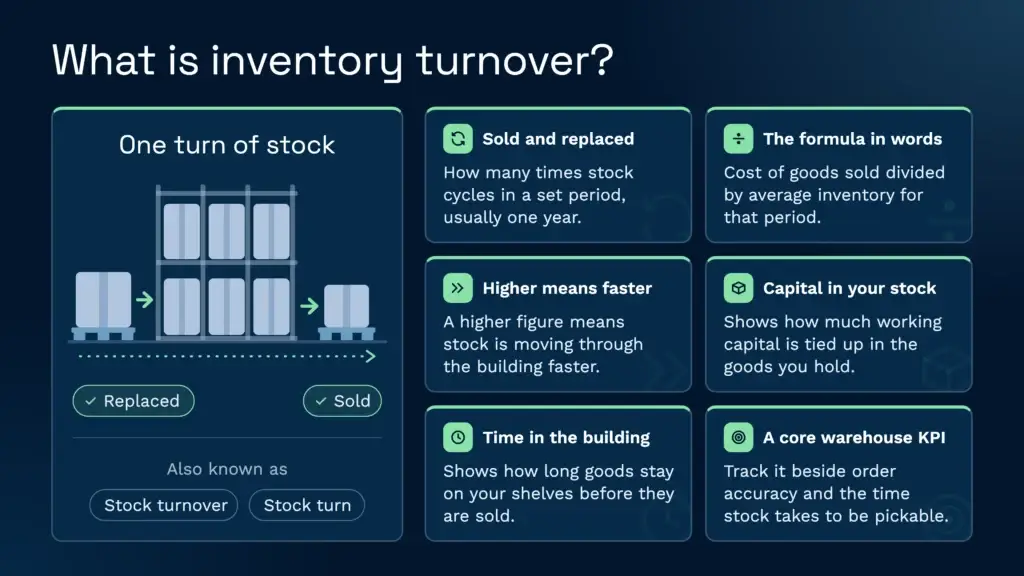
The inventory turnover formula
There are two common versions of the formula. The first uses cost of goods sold (COGS). The second uses sales revenue. Both divide by average inventory, which is explained below.
| Version | Formula | When to use it |
|---|---|---|
| COGS basis (preferred) | Cost of goods sold ÷ average inventory | Comparing the cost of goods shipped with the stock held to support them |
| Sales basis | Sales revenue ÷ average inventory | A rough estimate when cost of goods sold is not available |
COGS is the better choice because stock is recorded at cost. Sales revenue includes your margin, so dividing it by stock valued at cost overstates the turn, and the gap widens on higher-margin products. The Corporate Finance Institute’s guide to inventory turnover gives a second explanation of the COGS-based ratio.
Average inventory is the opening stock value plus the closing stock value, divided by two. Averaging smooths out a single month-end count that happens to be unusually high or low. For a monthly or quarterly figure, average the opening and closing values for that period.
Take a 3PL that holds stock valued at £120,000 on 1 January and £180,000 on 31 December. Over the year, the cost of goods sold for the stock it handled comes to £600,000. The worked example runs like this:
- Average inventory: (£120,000 + £180,000) ÷ 2 = £150,000.
- Inventory turnover: £600,000 ÷ £150,000 = 4.0.
A turnover of 4.0 means the stock was replaced about four times during the year.
Inventory turnover days
To calculate inventory turnover days, divide 365 by your inventory turnover ratio. The result is the average number of days stock sits before it sells. This measure is also called days sales of inventory or days inventory outstanding. In the example above, 365 ÷ 4.0 gives about 91 days, so stock spends roughly three months in the warehouse on average.
Days are often easier to discuss with a commercial team than a ratio. “Our stock sits for 91 days” leads to a more useful conversation than “our turn is 4.0”, because it points straight at the lines that are holding up the number.
What is a good inventory turnover ratio?
There is no single good number. A business selling fresh food will turn stock far more often than one selling durable furniture, so a ratio that looks strong in one sector can look weak in another. The most useful comparison is your own trend over time, followed by businesses that sell similar products in a similar way. Published sector figures are worth reading as context, but check how they were calculated before using them as a target.
The table below shows what different ratios mean in practice. The day counts are simple arithmetic from the formula above.
| Turnover ratio | Average days in stock (365 ÷ ratio) | What to check |
|---|---|---|
| 1.5 | About 243 | Stock sits for most of a year, so look for slow and obsolete lines |
| 4.0 | About 91 | Stock is replaced about four times a year, so compare against your own history |
| 12.0 | About 30 | Stock turns monthly, so confirm that stock-outs are not building up |
Is a high inventory turnover always good?
No. A high ratio can show that you run lean and sell efficiently. It can also mean stock is too thin to meet demand. Each direction carries its own risk.
- High turnover risk: stock-outs, lost sales, rushed and expensive replenishment, and customers waiting on backorders.
- Low turnover risk: dead stock, product close to its best-before or sell-by date, storage costs on lines nobody orders, and cash tied up in goods that may later need writing down.
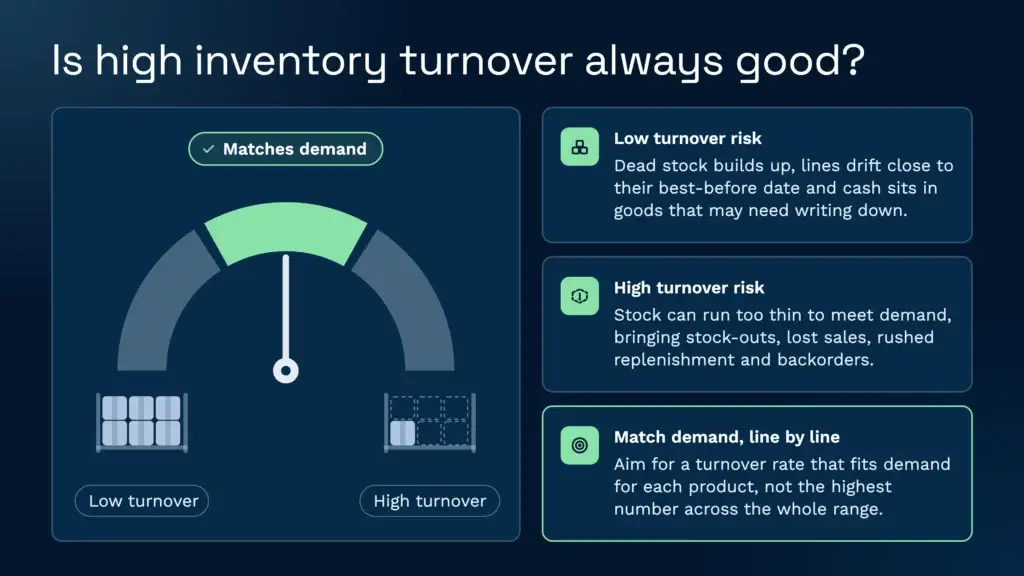
The aim is a turnover rate that matches demand for each product, not the highest possible number across the whole range.
Where inventory turnover misleads you
The ratio is a blunt tool, and three limits matter most in practice.
- Seasonality: a full-year average can hide a peak that drains stock in three months and a quiet period when lines barely move.
- Valuation method: how you value stock, whether by FIFO, weighted average or another method, changes both the closing stock figure and the cost of goods sold. The international standard on inventories, IAS 2, is a useful starting point for the accounting background on stock valuation.
- Averages hide slow lines: a healthy total can conceal individual SKUs that have not moved for months.
Stock accuracy is the fourth limit, and it is the one warehouse teams can control most directly. If the system count is wrong, the turnover figure is wrong too. The section below covers that in more detail.
How a warehouse can improve inventory turnover
For a warehouse, turnover is a summary of many small decisions on the floor. The levers you control are where stock is held, how it is picked, how often it is counted and how quickly slow lines are found. Work through them by SKU, by client and by location, because a single company-wide figure hides most of the problem.
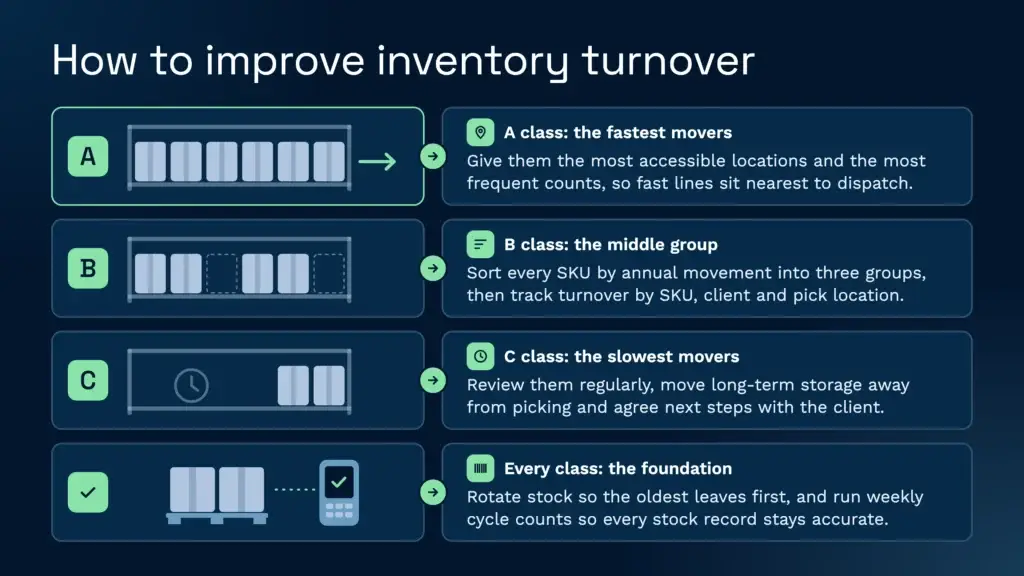
Measure turnover by SKU, client and location
A 3PL turns stock for many clients, so a blended figure can look healthy while one client’s range is stalling. Calculate turnover for each SKU first, then roll the figures up by client and by pick location. Location-level figures show whether slow lines are occupying fast-pick faces, which wastes space and travel time. Reporting that breaks stock movement down this way is the starting point, and our guide to warehouse reporting explains how to set it up.
Use ABC analysis to focus effort
ABC analysis ranks SKUs by value or by movement. A-class lines usually account for a large share of stock value, C-class lines for a large share of the count. Sort SKUs by annual movement, then split them into the three groups. Give A-class lines the most accessible locations and the most frequent counts, and review C-class lines regularly for stock that has stopped moving.
Replenish pick faces by demand
A fixed pick face can hold a pallet of stock that few orders ever call for, while the lines that sell fastest wait in slower locations. Demand-led replenishment moves stock into a pick face when orders need it, so the pick face reflects activity rather than a fixed allocation. In Clarus WMS, pick face automation can be driven by order volume, so a replenishment task is only created when an order needs more than the pick face holds. Our piece on warehouse replenishment covers the wider picture.
Rotate stock correctly
Stock rotation makes sure older stock leaves first, which protects turnover and reduces write-offs. Under FIFO, the earliest-received stock is allocated first. The catch is bulk storage. If the oldest pallet sits at the back of a stack, it cannot be reached without moving everything in front of it. Clarus WMS handles this with a scan-based switch that lets a picker take the pallet at the front, provided it has the same product, date and batch. FIFO and FEFO rotation can be set per client or per product.
Keep stock records accurate
Turnover is calculated from stock records. If the system shows 500 units and the shelf holds 430, every ratio built on that figure is wrong, and slow stock can hide in the gap. Mathew Buttar, Head of Solutions at Clarus, puts the priority plainly: “Your stock and how you control it … that is your number one job.”
Count often enough to trust the record without stopping operations. Cycle counting checks a rolling sample of locations each week, and the result of that sample tells you how accurate the rest of the warehouse is likely to be. Our guide to structured warehouse stock checks covers how to set this up. Stock identification also depends on consistent barcodes. Standards bodies such as GS1 UK set the barcode standards most warehouses use for SKU and pallet labels.
JODA Frakt, a 3PL, reached 99% stock accuracy, and stock takes that had taken weeks became a one-day job. For a team reading turnover figures, that accuracy is what makes the number worth acting on. Our guide to lagerkontroll sets out the basics of keeping records and stock aligned.
Find slow and obsolete stock early
Move long-term storage away from the picking zone so that fast-moving lines sit nearest to dispatch and travel less. Review every line with no movement over a set period, then decide whether to promote it, return it to the client, discount it or dispose of it. Clarus WMS lagerhantering gives the visibility to spot these lines early, and the decision still belongs with your client, because the stock is theirs.
Tala med en lagerarbetare
If you’re evaluating your options and want to see how a purpose-built WMS works in practice, Clarus is worth a conversation. We work with 3PLs and distributors to implement warehouse management software that fits the way you operate, not the other way around.
Kom i kontakt med vårt team att diskutera dina krav.