

Warehouse KPIs are a small set of measurable figures, calculated the same way every time, that show whether your warehouse is accurate, fast, safe and cost-effective. For most operations, five measures do most of the work: pick accuracy, on-time despatch, stock accuracy, dock-to-stock time and cost per order. This guide covers what each KPI measures, how to calculate it, where to start, and what 3PLs add on top.
Most managers already have plenty of numbers. The difficulty is choosing the few that drive decisions, defining them clearly and checking they’re true. The ASCM publishes a guide to eight KPIs for an efficient warehouse, which is a useful reference when you draw up your own list. For the wider operation, read our guide to how to manage a warehouse. This article goes deeper on the numbers.
If you want a professional reference point for standards in logistics and transport, CILT UK, the chartered body for the sector, is a sensible place to start.
What is a warehouse KPI?
A warehouse KPI is a measurable figure, calculated the same way each time, that shows how well one part of the operation is performing against a target. The test is simple: a KPI should change what someone does. Dock-to-stock time tells a receiving supervisor whether inbound is keeping pace with the lorries. Pick accuracy tells a manager whether picking is working. A figure nobody acts on is just a metric.
Rob O’Byrne’s LinkedIn article on choosing warehouse KPIs makes the case for balance. A sensible set covers speed, efficiency, cost, service and safety, and a long list of measures dilutes attention. He also points out that picking is usually the most time-consuming task in the building, so it needs both speed and accuracy measures.
The core warehouse KPIs and how to calculate them
The table below lists eight warehouse KPIs that cover receiving, inventory, picking, despatch, cost and space. The formulas are standard, so you can build them in a spreadsheet or pull them from your WMS. Set targets from your own baseline, because the right figure depends on your product mix, client agreements and building.
| KPI | What it tells you | Formula |
|---|---|---|
| Dock-to-stock time | How long inbound goods take to become available to sell | Average time from dock arrival to putaway complete |
| Faktisk aksje | Whether the system matches what is on the shelf | (Locations matching the count ÷ locations counted) × 100 |
| Plukkingsnøyaktighet | Whether the right item and quantity were picked | (Correct picks ÷ total picks) × 100 |
| Lines picked per labour hour | Picking productivity | Order lines picked ÷ picking labour hours |
| On-time despatch | Whether orders left when they were due | (Orders despatched on time ÷ orders due) × 100 |
| Perfect order rate | Orders that arrive complete, on time and undamaged | (Perfect orders ÷ total orders) × 100 |
| Cost per order | Efficiency of the whole operation | Total warehouse operating cost ÷ orders processed |
| Storage utilisation | How much usable space is in use | (Occupied locations ÷ usable locations) × 100 |
Each of these is a ratio or a time, and that matters. A raw count of 400 orders says little on its own. Four hundred orders out of 410 is 97.6%, and that figure tells you whether to worry.
Dock-to-stock time and receiving
Dock-to-stock time exposes a bottleneck before it reaches the customer. If stock sits in a goods-in area for a day, orders can’t be allocated to it, even though it’s physically in the building. Track the average, but also look at the slowest receipts. The average hides the pallets that wait longest, and those are usually the ones behind a missed despatch.
Stock accuracy and cycle counting
Stock accuracy is the KPI everything else depends on. If the system says 40 units are in a location and there are 35, the pick fails, the order shorts and the client hears about it. Mat Buttar, Head of Solutions at Clarus, who has spent around 25 years in warehouse operations, sees full stock checks and cycle counting working hand in hand. A full count sets the baseline, then regular counts weighted towards fast-moving stock keep it honest. As he puts it: “if I count 500 pallets a week… and it’s 99.2% accurate, then I can accept the rest of my stock is 99.2% accurate.”
The results can move quickly. JODA Frakt, a 3PL, reached 99% stock accuracy, and its stock counts went from weeks to one day. Our guide to doing a stocktake covers the mechanics, and Clarus supports structured stock checks and cycle counting.
Plukkingsnøyaktighet
Picking is where accuracy usually slips, and the cost of an error lands on the customer. Pick accuracy counts the picks that were right, but the real value is in spotting which error types keep recurring. Our guide to reducing picking errors covers the usual causes. Where a WMS is in place, the check can happen at the point of scanning. Clarus’s picking workflow uses barcode scans to confirm the right item at the point of pick, so the error is caught before the parcel leaves.
The five KPIs to start with
If you’re asking what the 5 KPIs for a warehouse are, start with pick accuracy, on-time despatch, stock accuracy, dock-to-stock time and cost per order. Together they cover accuracy, service, inventory control, speed and cost, so a good number in one area can’t hide a failing number in another.
Three tests help you decide whether a measure belongs on the list:
- Does it change a decision this week? If nobody would act on it, leave it out.
- Can you calculate it every week from data you already capture? If not, fix the data source first.
- Does it balance speed against cost or quality? If it doesn’t, pair it with a measure that does.
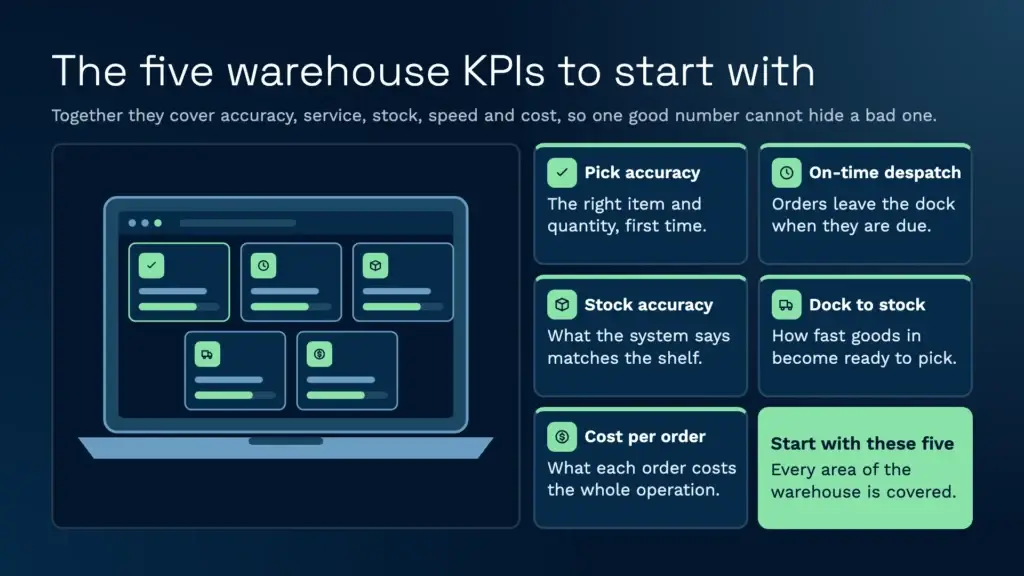
If you still work from paper or spreadsheets, begin with stock accuracy and pick accuracy. They need the least new data and expose the biggest risks first. Add cost per order once your costs sit in one place, because a cost figure built from partial data looks precise and isn’t.
Which KPIs each role should watch
Not everyone needs the same dashboard. A practical split is by decision and by frequency.
- Warehouse manager: cost per order, on-time despatch, perfect order rate, storage utilisation and safety incidents, reviewed weekly against a monthly trend.
- Shift supervisor: pick accuracy, lines picked per labour hour, dock-to-stock time and the open despatch backlog, reviewed at the start and end of each shift.
- Operative: their own pick accuracy and scan exceptions, shown as a personal trend and used for coaching rather than ranking.
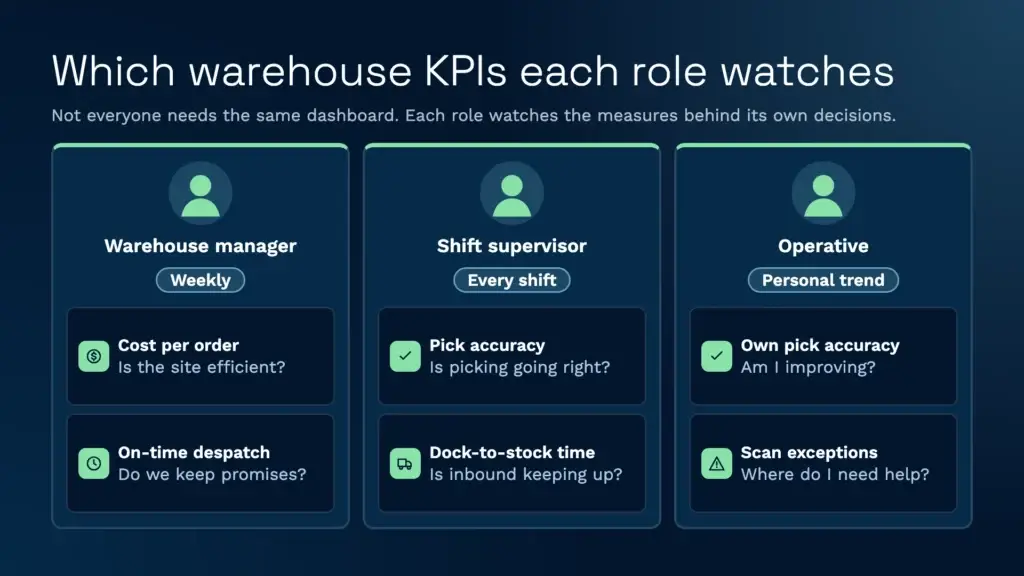
The last point matters. Individual productivity figures help when a supervisor uses them to support someone who is struggling. They work badly as a league table, because they reward whoever happens to get the easy aisles. Clarus records who did each task and when, so supervisors can see activity by person without building that view by hand. Read more about operator activity tracking.
KPIs for 3PLs: billing accuracy and client service
A 3PL needs the standard list plus measures that show each client is charged correctly and served to contract. Two matter most. Billing accuracy is the share of billable events that were captured and invoiced: (billable events invoiced ÷ billable events performed) × 100. Client service level is the share of a client’s orders that met that client’s contracted despatch time. Track both by client, because an average across twenty clients hides the one who is consistently out of SLA.
Billing accuracy depends on capturing charges as the work happens. Clarus’s klientfakturering turns completed tasks into invoices and applies each client’s tariff automatically, so the invoice reflects the work done rather than a month-end estimate. The change shows most clearly in the back office. Lageret i St John’s Hall had spent around four days at the end of each month checking invoices that had been re-keyed from the WMS into its accounts package. Invoicing time fell by 90%, and that re-keying is gone.
Client-facing measures improve too. The kundeportal lets each client see stock levels and order status without calling the warehouse, so status questions don’t have to pass through the operations team.
Benchmarks and where to find them
A KPI is easier to judge when you can compare it with others. The Warehousing Education and Research Council (WERC) runs an annual DC Measures study with DC Velocity. Its 2024 edition covered 38 operational metrics, and its online benchmarking tool holds DC Measures data back to 2013, according to MHI Solutions’ report on the 2024 study. Den WERC DC Measures survey asks participants to rate their own performance on each metric, which shows the kind of measures the study tracks.
Use benchmarks as a direction check rather than a target. A benchmark from a high-volume automated site tells you little about a multi-client ambient 3PL, so compare like with like. Your own trend line is the best measure of progress, and it’s the one you control.
Warehouse KPI template and dashboard
A warehouse KPI template works best as a single sheet with one row per measure. You can build it in Excel now and move it into your WMS reporting later. Use these columns:
| Column | What to enter | Why it matters |
|---|---|---|
| KPI | The short name, such as pick accuracy | Keeps the list easy to scan |
| Definition | Plain English, including what counts and what doesn’t | Stops two people calculating different things |
| Formula | The exact calculation, written out | Makes the number reproducible |
| Data source | The report, screen or system the figures come from | Shows where to check when a number looks wrong |
| Owner | One named person | Makes clear who acts on the figure |
| Frequency | Daily, weekly or monthly | Matches the review cycle to the decision |
| Target and trigger | The goal, and the level that prompts action | Turns a report into a decision |
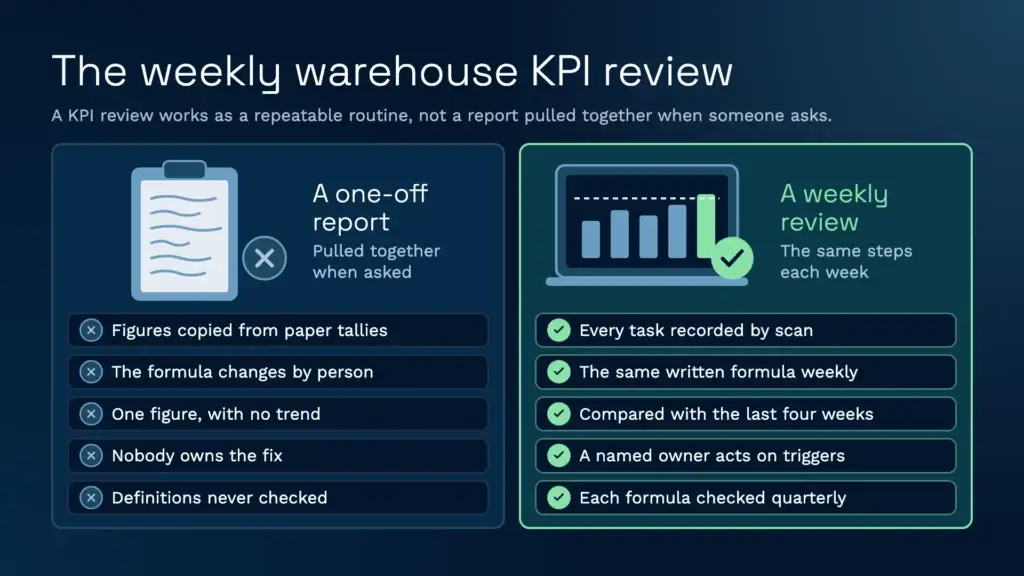
On the dashboard side, the trend matters more than any single figure. Clarus’s rapportering gives live exception and variance views, and every scanned movement records who did it and when. That gives a manager the audit trail behind a KPI, which is what you need when a figure looks wrong. Interspan cut its reporting time by 90% after replacing a legacy on-premise system.
Where warehouse KPIs go wrong
The most common failure is the data, not the maths. A KPI calculated from scans is only as honest as the scanning behind it. The system records what people scan, but it can’t stop someone from scanning one item and then picking another. Build your review habit around checking the source when a number jumps.
Cost-only measures mislead too. As O’Byrne points out in his LinkedIn article, a productivity gain bought with extra staff isn’t real efficiency, so read cost and productivity side by side.
A WMS won’t fix poor master data or weak labelling discipline. It makes the process faster and more visible, which helps when the process is sound and exposes the problem when it isn’t. If your product codes or locations are messy, the KPIs will show that mess in more detail.
Safety belongs on the list as well. The Health and Safety Executive’s veiledning om lagerhold sets out the main causes of injury and ill health in the sector, and HSG76, Warehousing and storage: a guide to health and safety, is the core document. It was first published in 2007, so check HSE’s publications page for the current edition before you build safety measures on it. Track accident counts and near misses reported, and watch the trend.
If you’re weighing a system that will report these numbers, read our guide to the beste WMS options and our breakdown of WMS-kostnad før du begår deg.
Snakk med en lageransvarlig
If you’re evaluating your options and want to see how a purpose-built WMS works in practice, Clarus is worth a conversation. We work with 3PLs and distributors to implement warehouse management software that fits the way you operate, not the other way around.
Ta kontakt med teamet vårt å snakke gjennom dine krav.