

Nye dashbord innebar enten teknisk konfigurering eller å måtte vente på IT-avdelingen
Spørsmål om rapporter, rapporter og widgets vises på egne skjermbilder
Et raskt spørsmål innebar å tegne et diagram for hånd
Rollespesifikke visninger innebar å måtte gå gjennom irrelevante data
Describe a metric in plain English and the AI builds the widget
See a preview of the live data before anything is added
Widgets follow your date, warehouse and account filters
Rename it by asking, or drag and resize it yourself
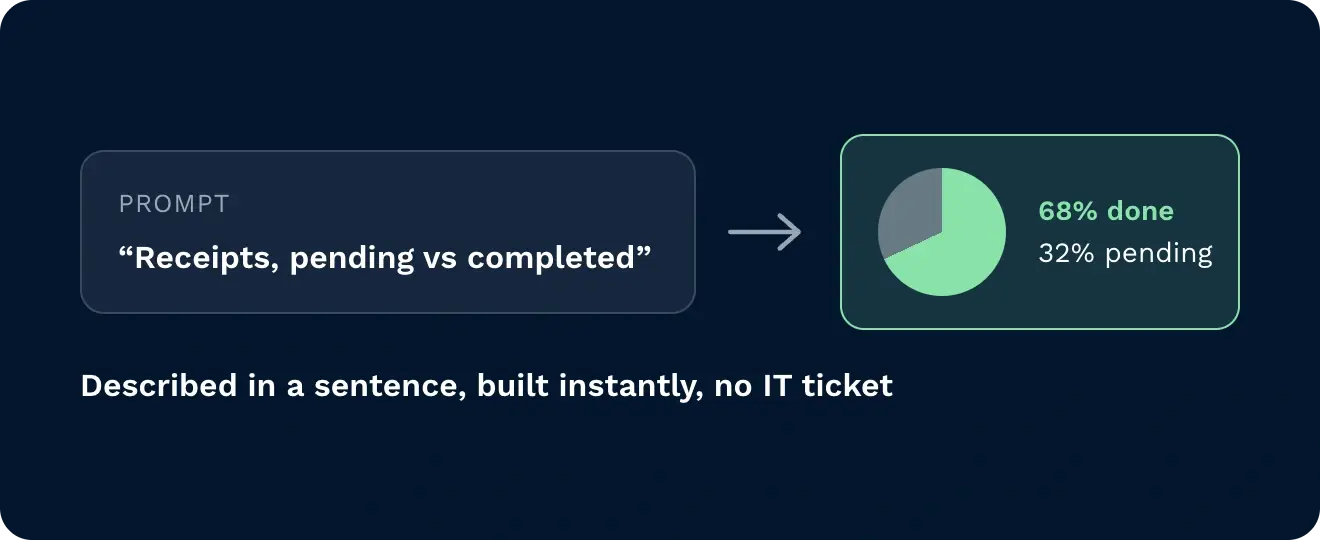
Beskriv hvilken måleenhet du trenger, og AI-systemet setter det opp umiddelbart – uten manuell konfigurering eller ventetid på IT-avdelingen. En enkel kommando gjør kvitteringer om til et sirkeldiagram som viser «ventende» kontra «fullført», eller sorterer innkjøp i et stolpediagram etter hvem som har mest å gjøre.
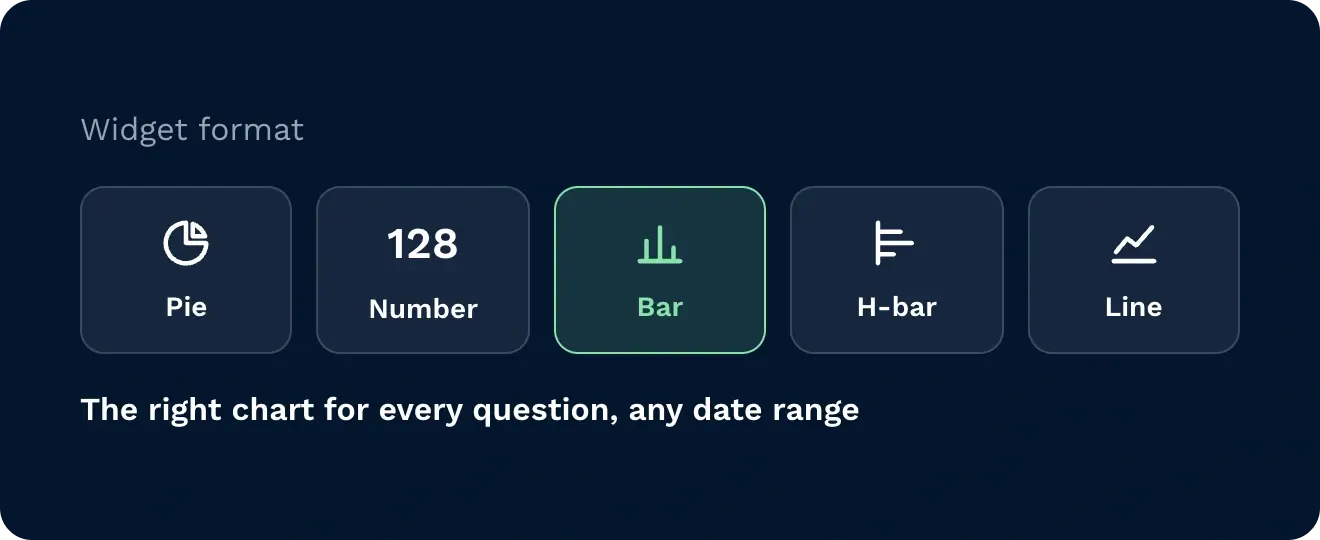
Not every metric needs the same chart. Ask for a pie, a single number, a bar or horizontal bar, or a line chart, from receipts by status to goods in received per day across the date range you pick.
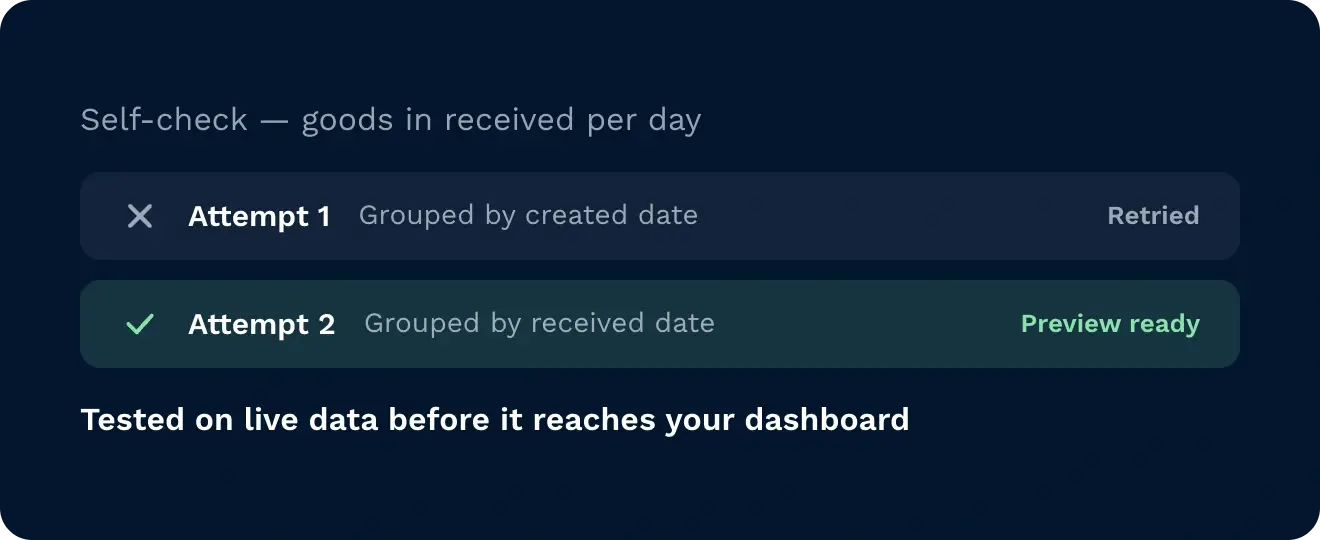
The AI tests its query and shows you a preview of the live data before a widget lands. If an attempt fails, it tries another way, for example grouping by a different date field, until the result matches what you asked for.
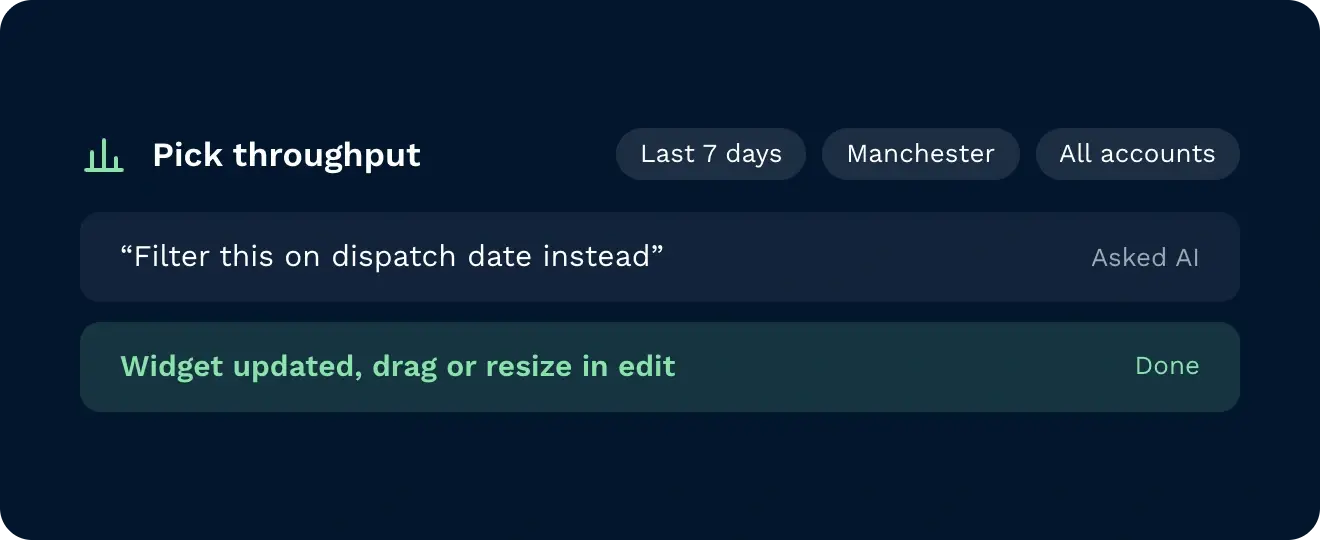
Every widget follows the dashboard filters for date, warehouse and account. Ask the AI to rename a widget or change which date it filters on, or press edit to drag and resize it.
Når du trenger tall, har du ikke tid til å vente på en rapportforespørsel. Skreddersydde dashbord, utviklet ved hjelp av AI, Svaret vises på få sekunder, slik at en statusoversikt blir til et sirkeldiagram, antall fullførte bestillinger blir til en måleparameter, og plukkprestasjonen blir til et stolpediagram sortert etter hvem som har mest å gjøre. Hvis du ber om en trend, vises innkommende varer som et linjediagram over det datointervallet du velger. Filtrer etter lager og dato, og gi deretter widgetene nye navn, endre størrelsen på dem eller flytt dem på få sekunder. Skreddersydde oversiktsverktøy eliminerer ventetiden, slik at du kan konsentrere deg om lagerbeholdning, ordrer og arbeidskraft der det er viktigst.

Få oversikt over status for kvitteringer, ordrer og plukking uten å måtte vente på at noen skal sette det sammen. Be om en oversikt, et tall eller en trend, så oppdateres oversikten på få sekunder, kan sorteres etter lager og dato.

Følg med på hvem som har mest å gjøre på plukkingen, og oppdag en forsinkelse før skiftet kommer på etterskudd. Be om oppgaver etter bruker og få et stolpediagram sortert etter volum, som oppdateres i sanntid. Filtrer etter lager uten å bytte skjermbilde.

Følg opp fullførte bestillinger og mottaksstatus uten å måtte lage en rapport fra bunnen av. Be om en oversikt over fullførte bestillinger eller en oversikt over mottatte varer fordelt på dag. Ingen manuell søk, ingen ventetid på IT-avdelingen.
Du beskriver hva du ønsker å se, og så blir det laget. Det er ingen spørsmålsgenerator, ingen diagramkonfigurasjon og ingen manuell valg av datakilde. Du skriver inn en forespørsel i vanlig språk, og en fungerende widget dukker opp på dashbordet ditt.
Hvis du kan beskrive måleparameteren, kan du lage widgeten. Ingen SQL, ingen filtre som må konfigureres manuelt. Be om kvitteringer sortert etter status, antall fullførte bestillinger eller plukkoppgaver sortert etter bruker, så finner AI-en ut hvordan det skal vises.
Den velger det riktige formatet for spørsmålet, ikke bare diagrammer. En statusoversikt blir til et sirkeldiagram, en rangert sammenligning blir til et stolpediagram, en trend over tid blir til et linjediagram, og en enkel sum blir til et enkelt tall.
Den sjekker sitt eget arbeid før widgeten blir publisert. Hvis et første forsøk på å gruppere dataene ikke stemmer overens med det du ba om, korrigerer AI-systemet selve søket, slik at det som vises på dashbordet er riktig.
Ingenting er fastlåst når det først er plassert på oversikten. Widgets kan omdøpes, endres i størrelse eller flyttes, og oversikten kan fortsatt filtreres etter datointervall og lager etter at den er opprettet.
Yes. Build as many as you need, for example an operations overview for one person and a picking view for another.
Yes. Widgets follow the dashboard’s date, warehouse and account filters, and you can ask the AI to filter on a different date field.
Fortsatt usikker? Bruk fire minutter på å se Clarus håndtere varemottak, plukking og utsendelse. Du vil se hvorfor Kundene våre sier stadig ”ja” til nye kontrakter.