

New dashboards meant technical setup or a wait for IT
Report queries, reports and widgets sat as separate screens
A quick question meant building a chart by hand
Role-specific views meant sifting through irrelevant data
Describe a metric in plain language and the AI builds the chart
Pick tasks, receipts and orders turn into charts, grouped and sorted
Widgets stay filterable by date and warehouse once they’re built
Rename, resize or move any widget in seconds, no ticket needed
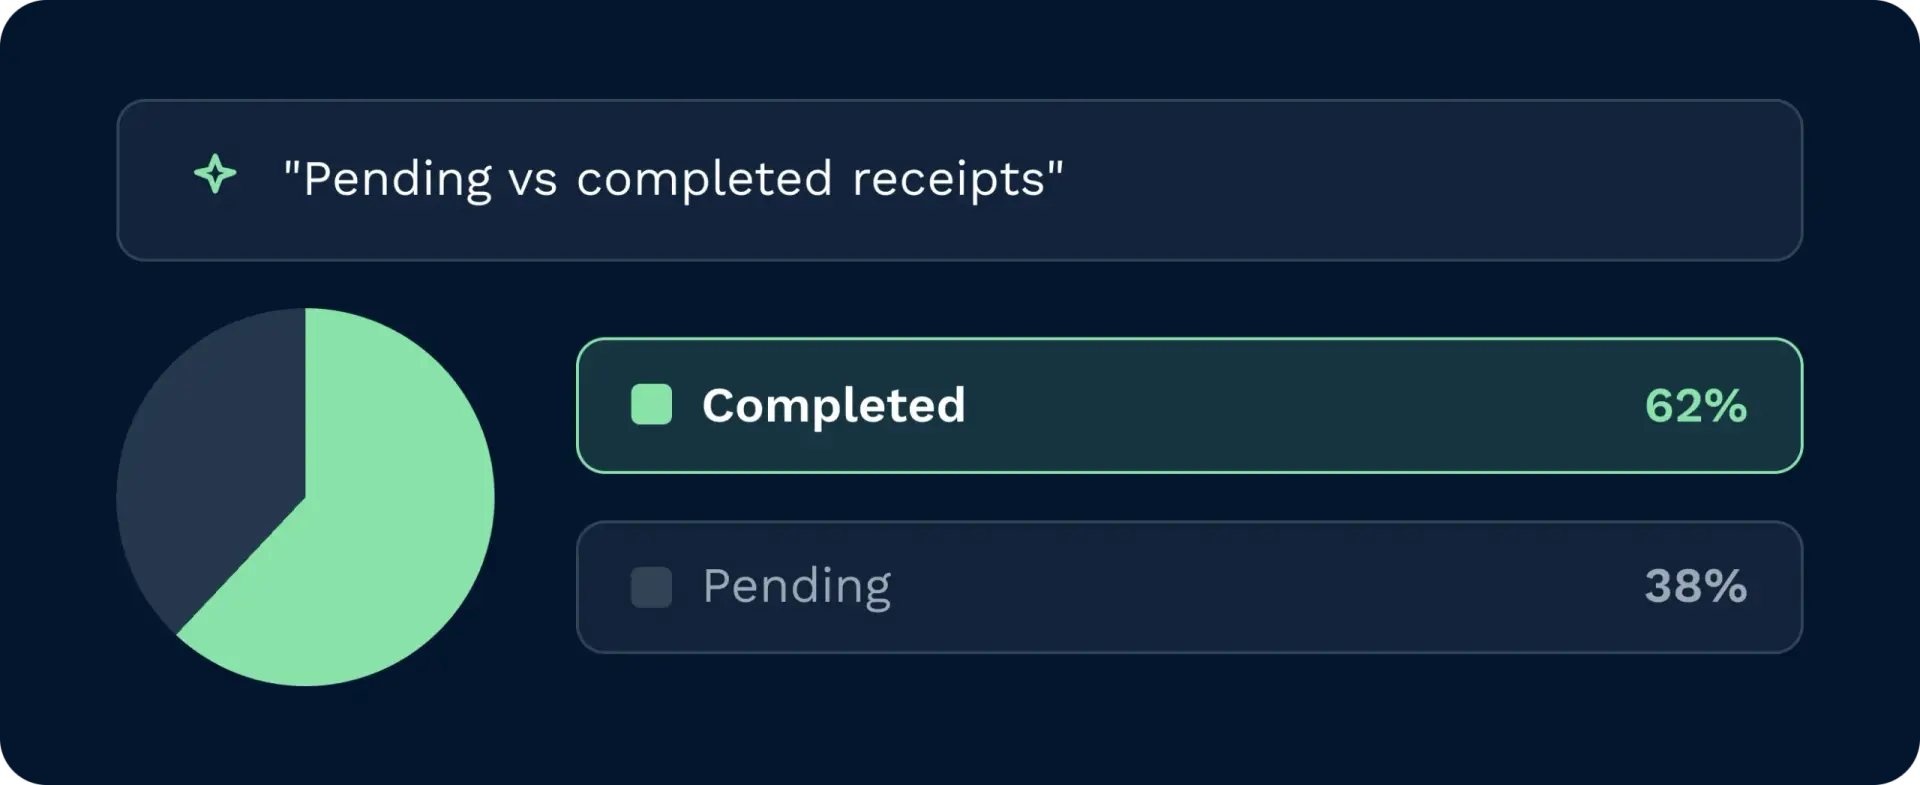
Describe the metric you need and the AI builds it instantly, no manual setup or waiting on IT. A simple prompt turns receipts into a pending-versus-completed pie chart, or picks into a bar chart sorted by who’s busiest.
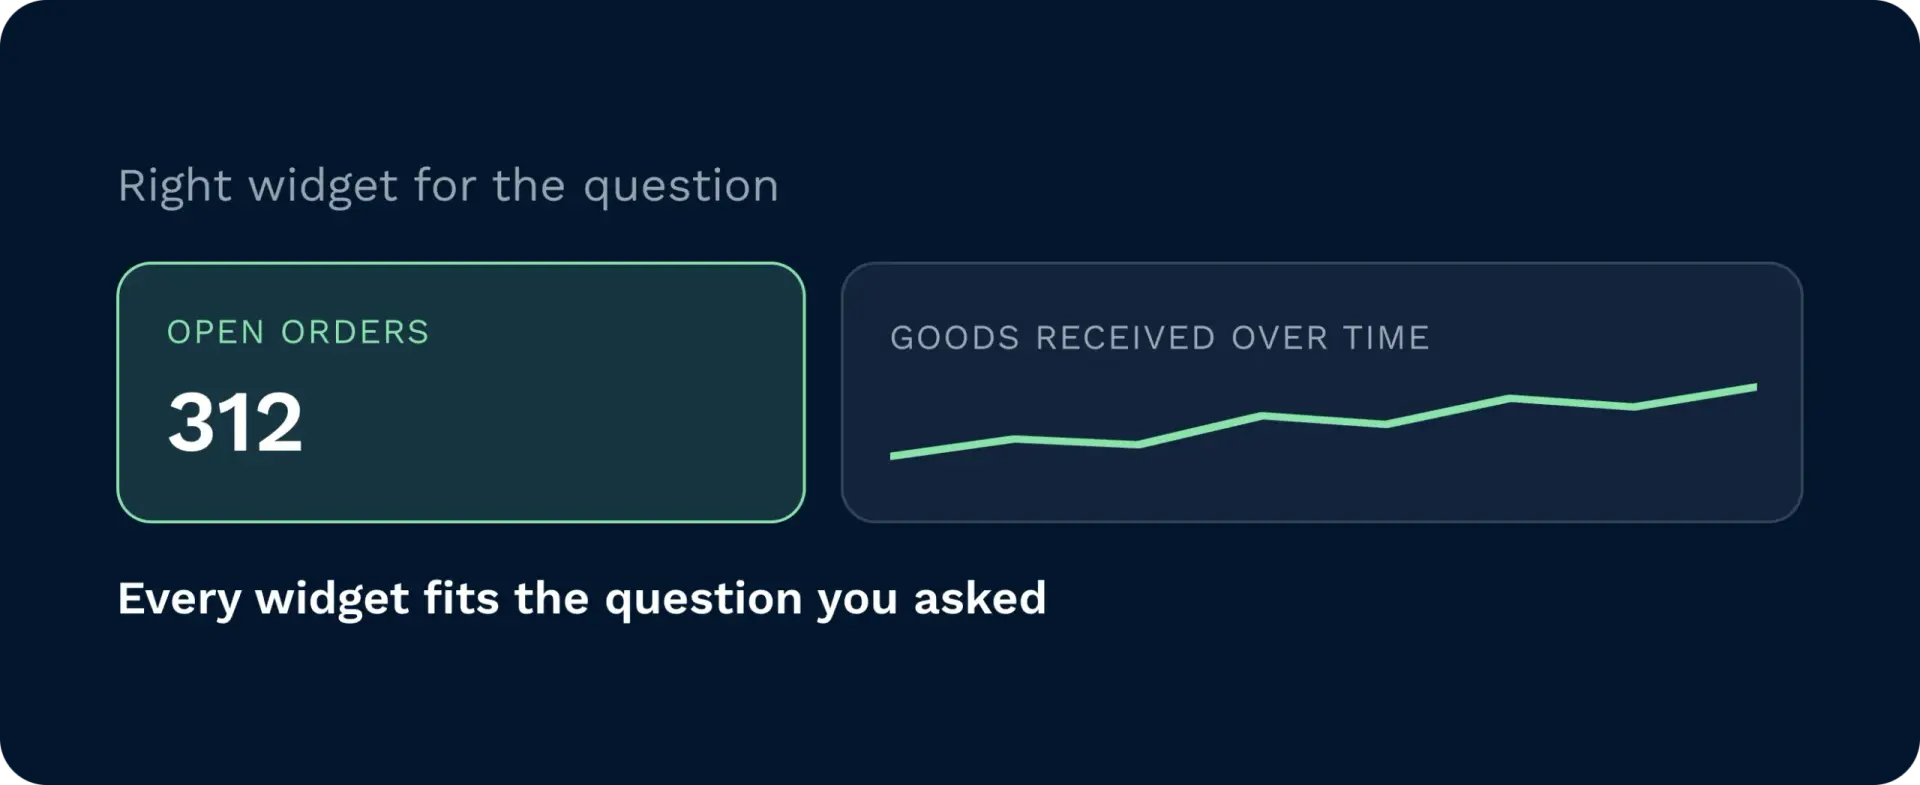
Not every metric needs a chart. Ask for a count, a trend, or a breakdown and the AI picks the right format, from a single number to a line chart showing goods received over time. Every widget fits the question you asked.
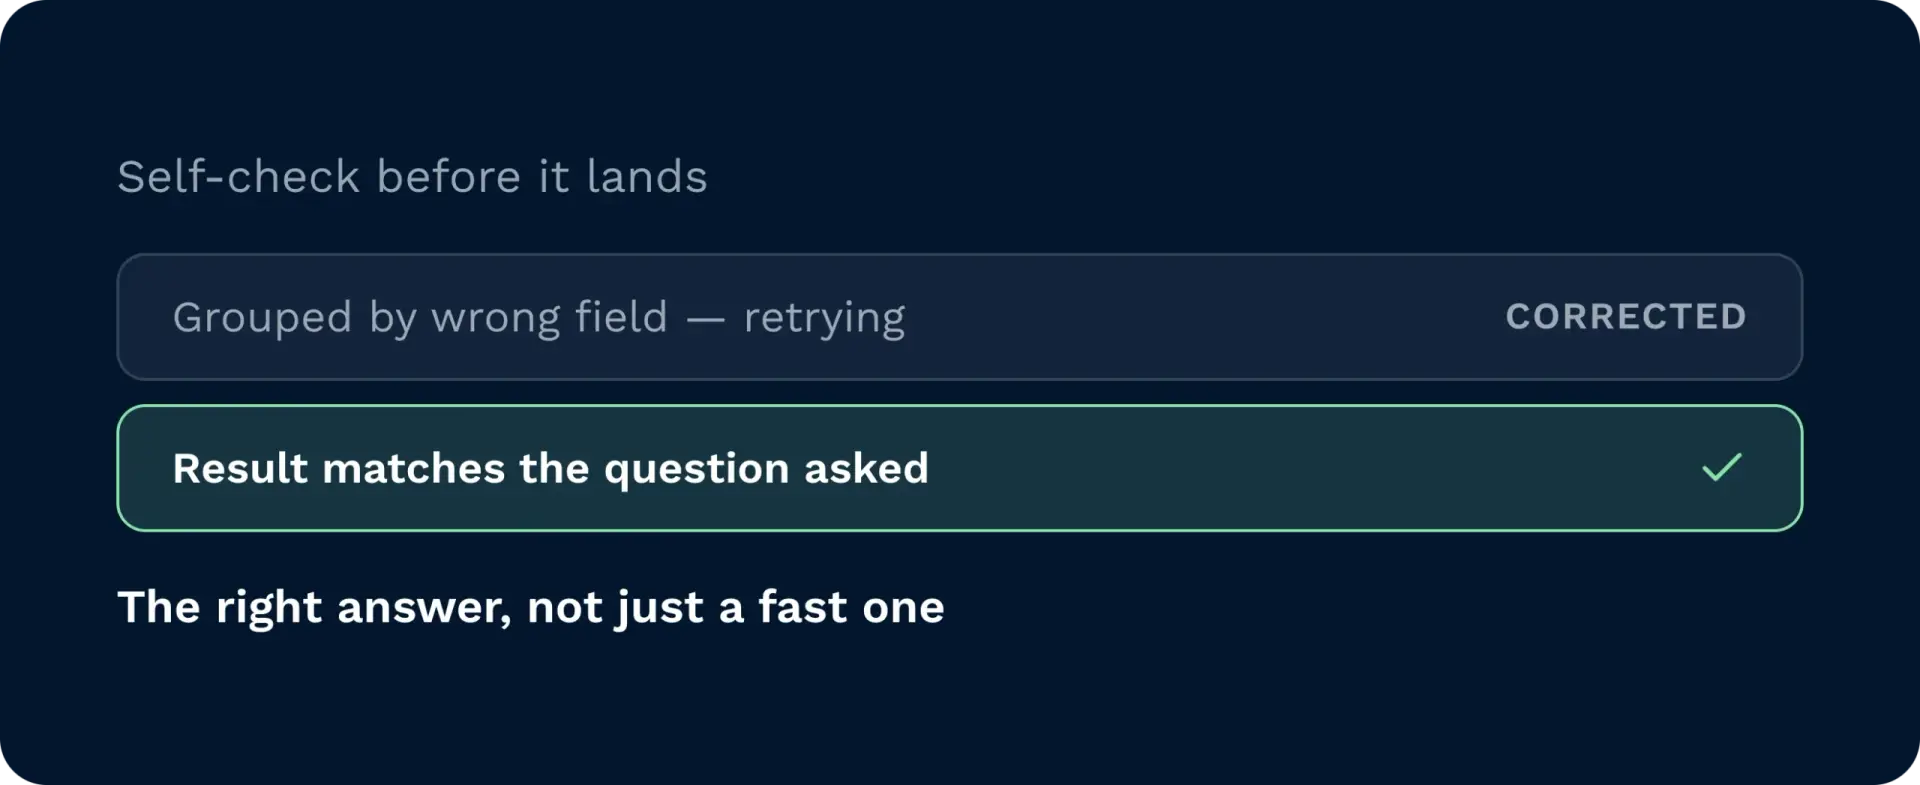
The AI checks its own logic before a widget lands on your dashboard. If a query groups the data wrong, it corrects itself until the result matches what you asked for. You get the right answer, not just a fast one.
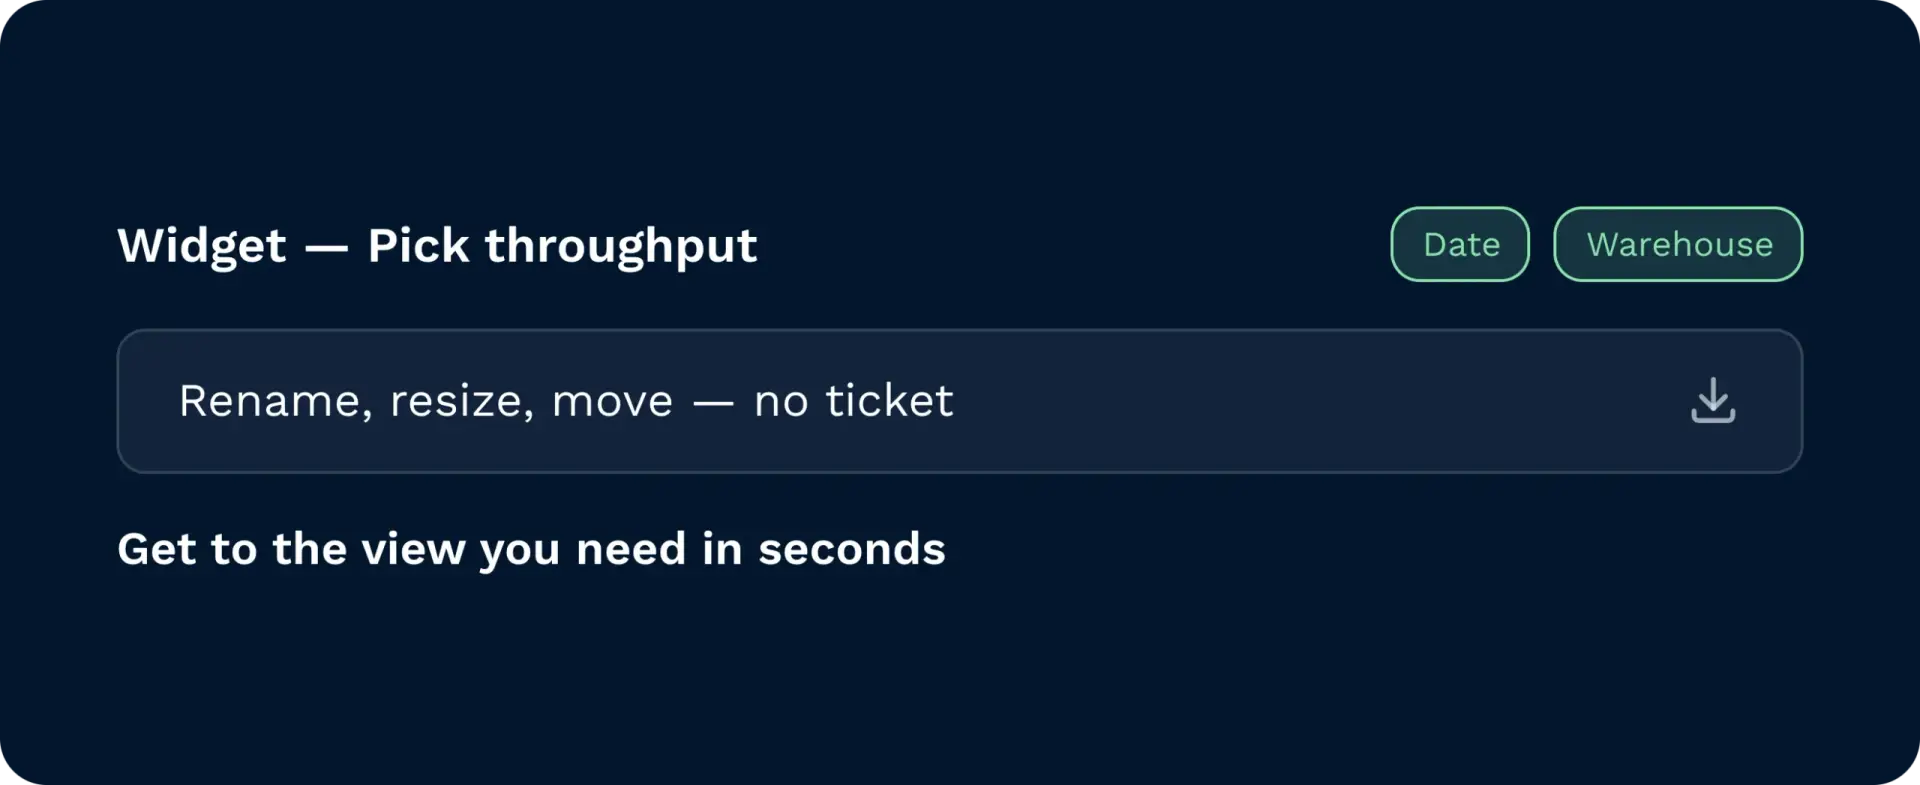
Every widget stays filterable by date and warehouse once it’s built. Rename, resize, or move anything on the dashboard without raising a ticket. Your team gets to the view they need in seconds.
When you need a number, you can’t afford to wait on a report request. Bespoke dashboards, built using AI, surface the answer in seconds, so a status breakdown becomes a pie chart, a completed order count becomes a metric, and picking performance becomes a bar chart sorted by who’s busiest. Ask for a trend and goods inbound becomes a line chart across the date range you choose. Filter by warehouse and date, then rename, resize, or move any widget in seconds. Bespoke dashboards remove the wait so you focus on stock, orders, and labour where it matters most.

See status across receipts, orders, and picking without waiting for someone to build it. Ask for a breakdown, a count, or a trend and the dashboard updates in seconds, filterable by warehouse and date.

Track who’s busiest on the pick, and spot a stall before the shift falls behind. Ask for pick tasks by user and get a bar chart sorted by volume, updated live. Filter by warehouse without switching screens.

Track completed orders and receipt status without building a report from scratch. Ask for a count of completed orders or a trend of goods received by day. No manual query, no waiting on IT.
You describe what you want to see, and it gets built. There’s no query builder, no chart configuration, no picking a data source by hand. You type a plain-language request and a working widget lands on your dashboard.
If you can describe the metric, you can build the widget. No SQL, no filters to configure manually. Ask for receipts by status, a count of completed orders, or pick tasks by user, and the AI works out how to show it.
It picks the right format for the question, not just charts. A status breakdown becomes a pie chart, a ranked comparison becomes a bar chart, a trend over time becomes a line chart, and a simple total becomes a single number.
It checks its own work before the widget goes live. If an initial attempt at grouping the data doesn’t match what you asked for, the AI corrects the query itself so what lands on the dashboard is right.
Nothing about it is fixed once it’s on the dashboard. Widgets can be renamed, resized, or moved, and the dashboard stays filterable by date range and warehouse after creation.
¿Todavía indeciso? Dedica cuatro minutos a ver cómo Clarus se encarga de recepción de mercancías, preparación de pedidos y expedición. Ya verás por qué Nuestros clientes siguen diciendo ”sí” a nuevos contratos.